Design components: Charts
Pre-designed charts
With Pixelmost there are a lot of included predesigned components you can use in your app design. One of these types are Charts. With charts you get beautiful native chart designs you can use to represent your data with. Choose from a wide selection of predesigned chart types and adjust colors and axis to match the rest of your designs.
Our long term goal is here to allow you to connect this with your own mocked data to better suit the type of data you want to represent in your designs. For now the type of data is the same per chart type.

Get Started with our Chart Template
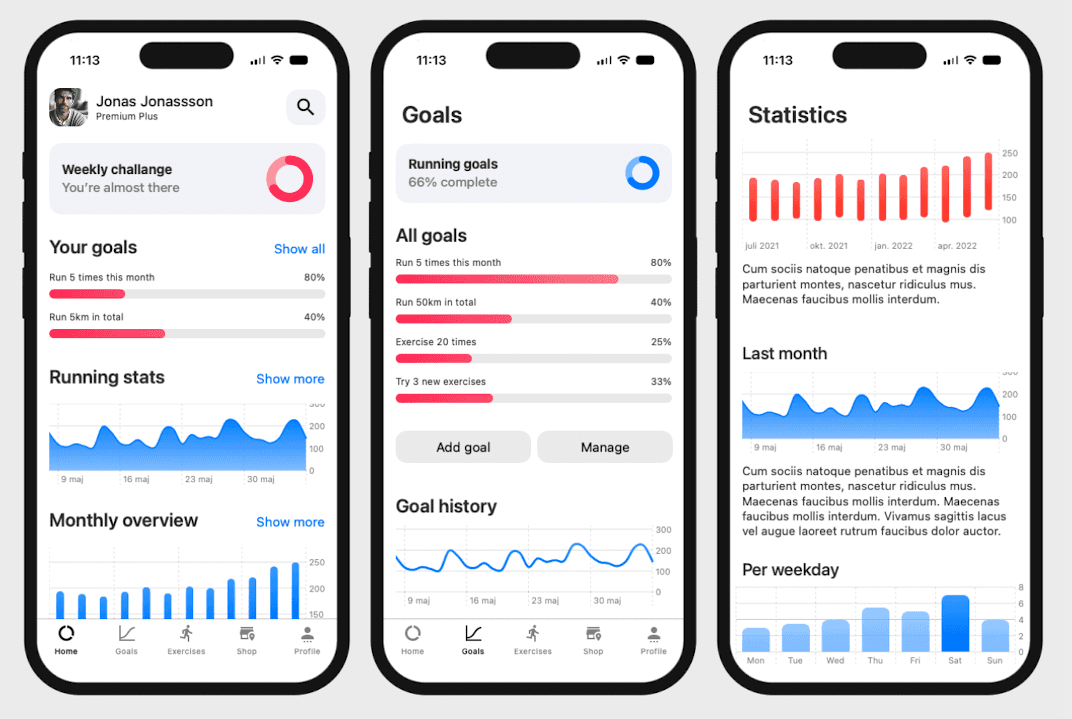
With our bundled Chart App Design Template you can get started right away with an app with focus on charts. Or use this to get inspired on how and which chart types to use. Pixelmost features a wide range of chart types:
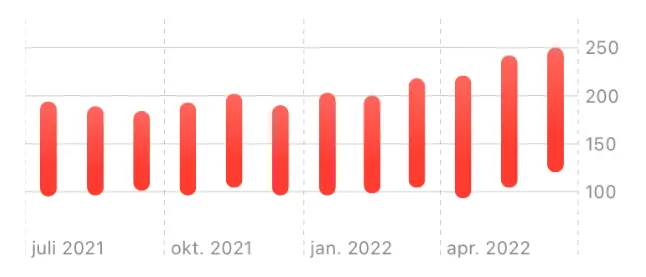
Bar charts display information suitable for representing variation in state from day to day.
Our line charts and area charts are suitable for information that can vary continuously over for example time.
Circle can horizontal bar charts are perfect to represent progress och percentages.

Upcoming features and views
We continuously improve and expand the features and views in PIxelmost. We have a lot of Chart features and templates in the roadmap. If you have any special request or feedback, make sure to contact us. We're always interested in what you as a user is interested in.

